This website uses cookies so that we can provide you with the best user experience possible. Cookie information is stored in your browser and performs functions such as recognising you when you return to our website and helping our team to understand which sections of the website you find most interesting and useful.
Prioritizing Features & Ideas by Best Economic Return with a Prioritization Matrix
Estimated reading time: 4 minutes, 44 seconds
Prioritization frameworks & tools
One of the biggest challenges of a Product Manager is the prioritization of features, essentially what to develop in which order, as there are so many factors that may impact this decision, such as reach, impact/ value (to business and client), effort/ complexity, cost of development, risk, cost of delay, opportunity enablement, risk reduction, and time criticality, amongst others.
Prioritization should never be opinion-based but in reality, it often is when you have a lot of stakeholders involved. So putting a prioritization framework in place that you can get everyone aligned on (team, senior stakeholders, clients) is invaluable for decision-making.
There are many prioritization frameworks out there, each using a different combination of some of the factors mentioned above, and depending on your use case, most of them will help you roughly decide, in one form or the other, in which order you should develop your features. If you are interested in an overview of the main frameworks and what their strengths and limitations are, have a look at the following resources:
- 9 product prioritization frameworks for product managers (Roadmunk)
- 37 Frameworks to Help You Become a Better Product Manager: Prioritization Frameworks (ProductPlan)
If you work in a large organization, it’s likely that you will use a product management tool that helps you with prioritization, such as ProdPad, Roadmunk, Airfocus or productboard. Whilst they offer good prioritization frameworks with matrix visualizations, the service comes at a price that may not be the best use of budget for smaller organizations. Also, the integration with ticket management tools such as JIRA can be cumbersome and not as seamless of a process to embed. So, if you are looking for something lightweight and cost-effective (well, free really), here it comes!
Prioritization by WSJF (Weighted Smallest Job First)
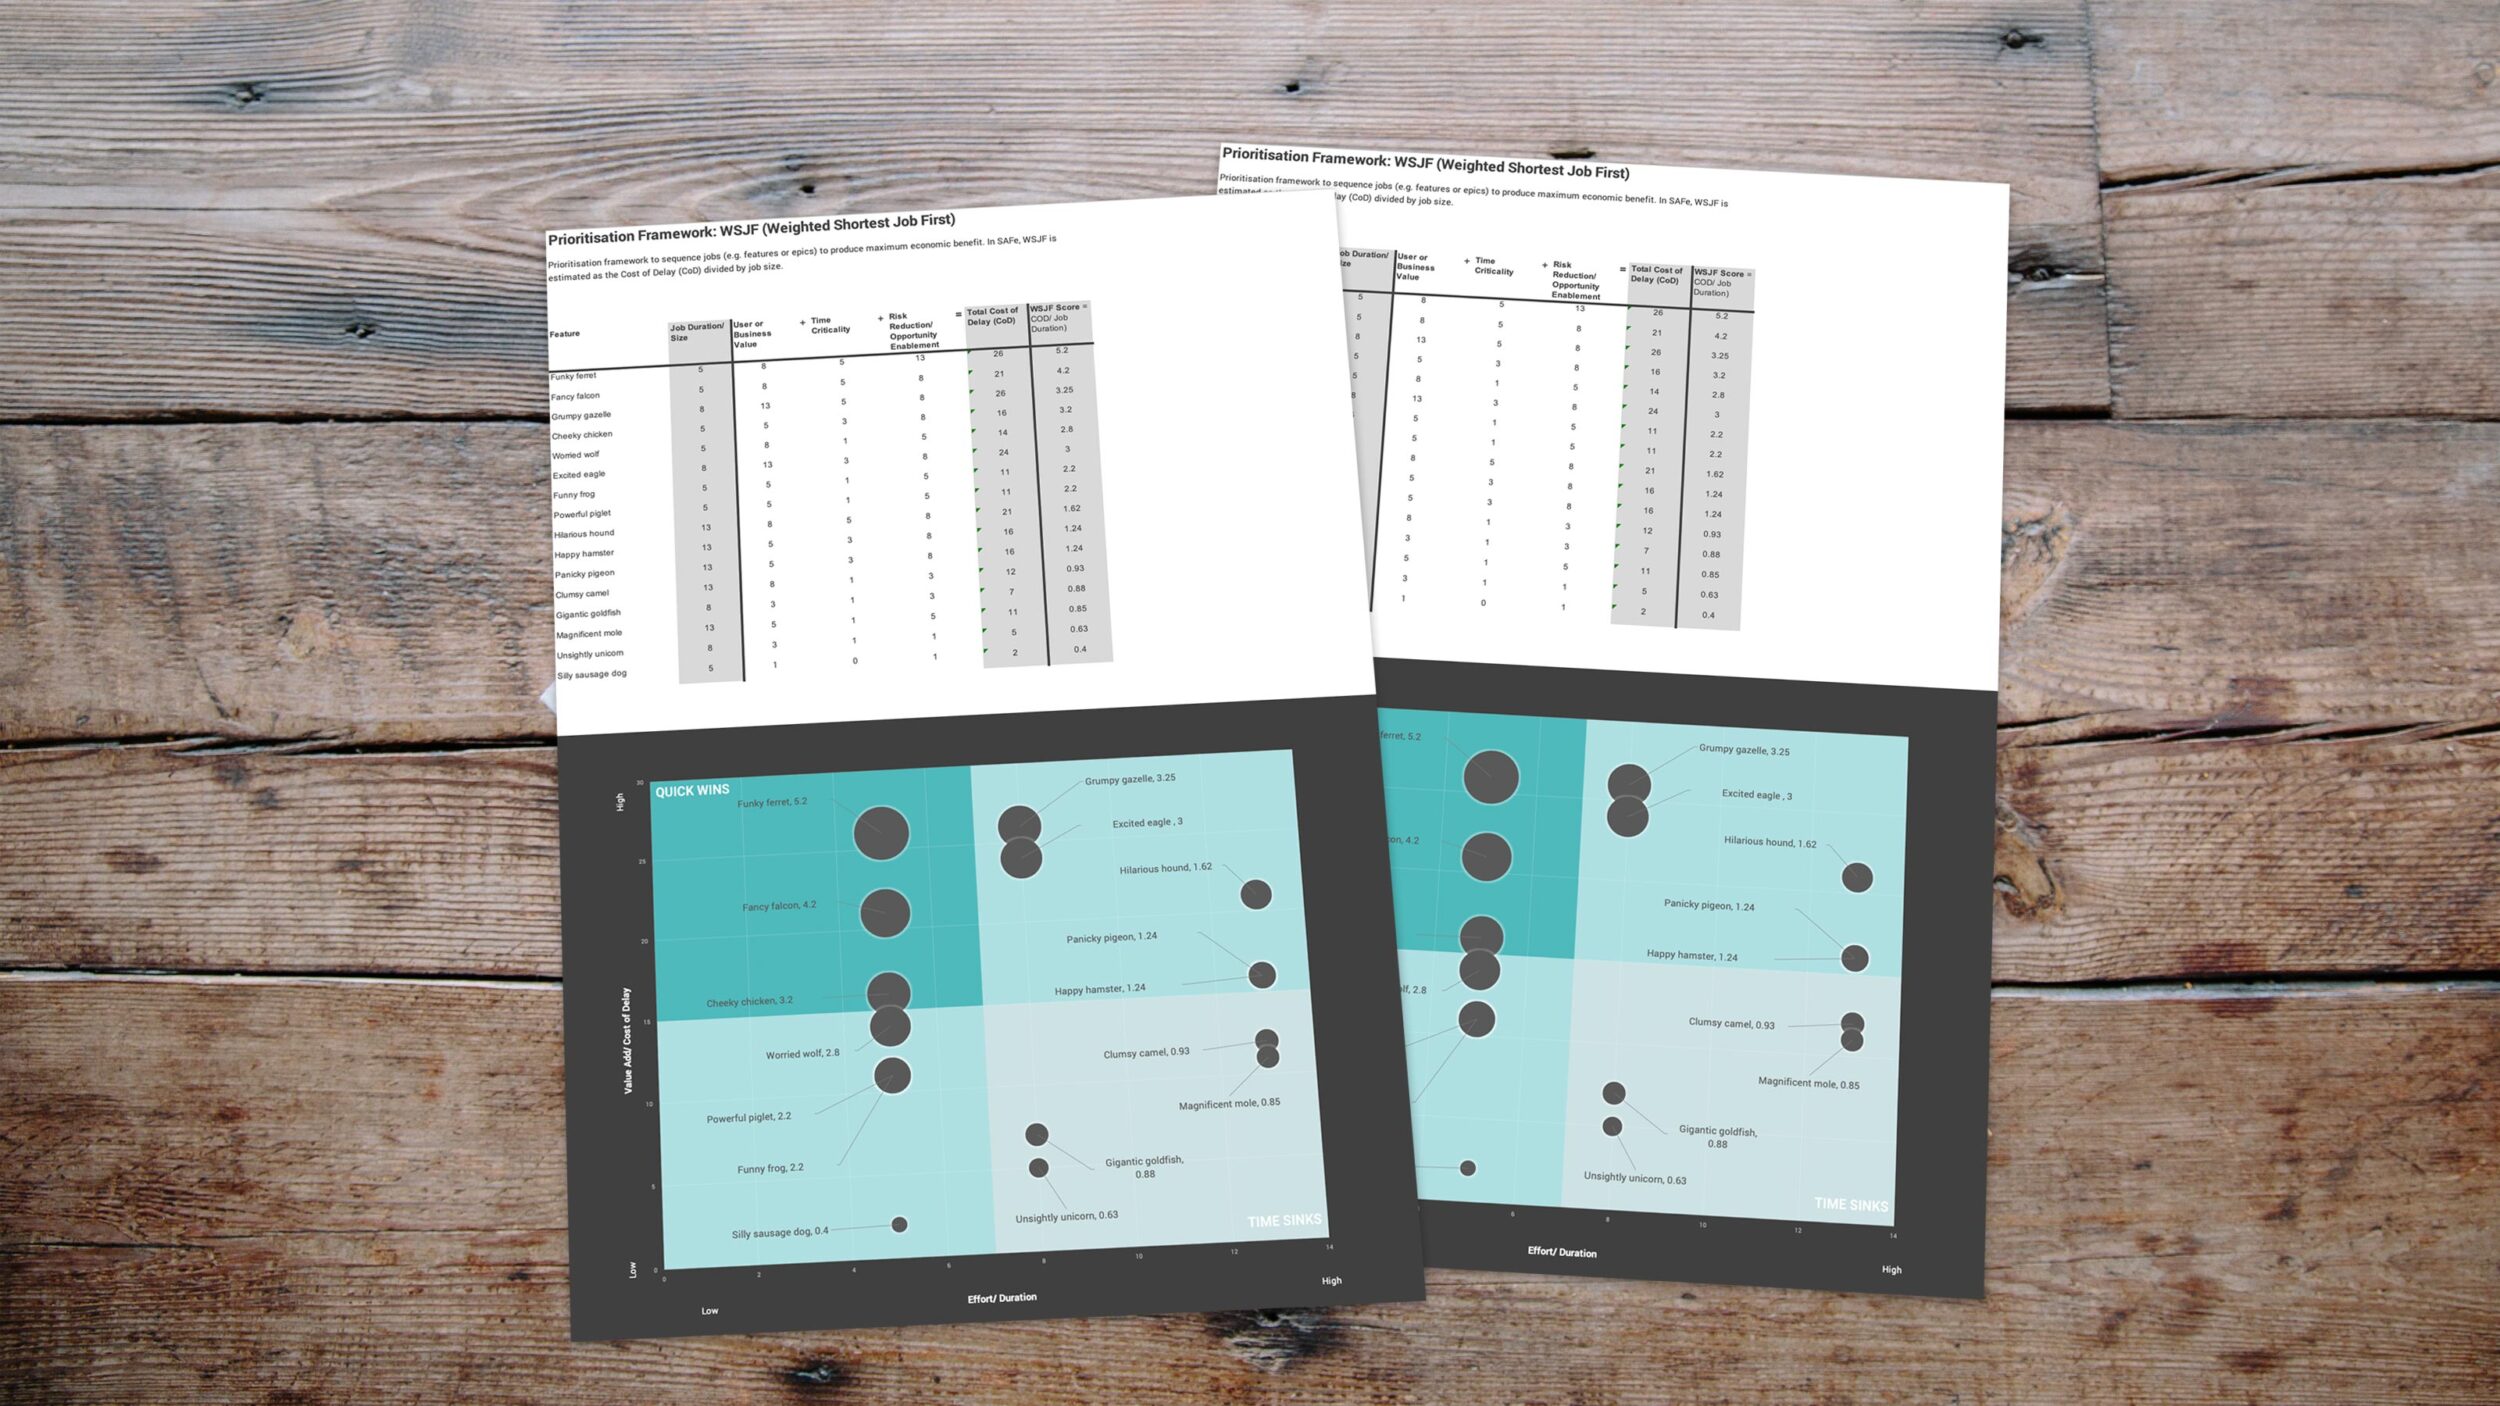
I first heard about the prioritization framework WSJF (Weighted Smallest Job First) in the SAFe/ Scaled Agile course that I did a few years ago. WSJF is a prioritization model used to sequence jobs (e.g. features, capabilities, and epics) to produce maximum economic benefit. In SAFe, WSJF is estimated as the Cost of Delay (CoD) divided by relative job size, and the gist of it is that jobs that can deliver the most value (or CoD) in the shortest duration provide the best economic return. You can find a more detailed description and visualization of how exactly this works here.
I tend to export my filtered features or epics from Jira (label = WSJF) and then use Excel for the prioritization task but obviously, any other spreadsheet tool will do. Also, depending on the amount of features or epics you want to map, it may be quicker to just write them up manually rather than going through the export task.
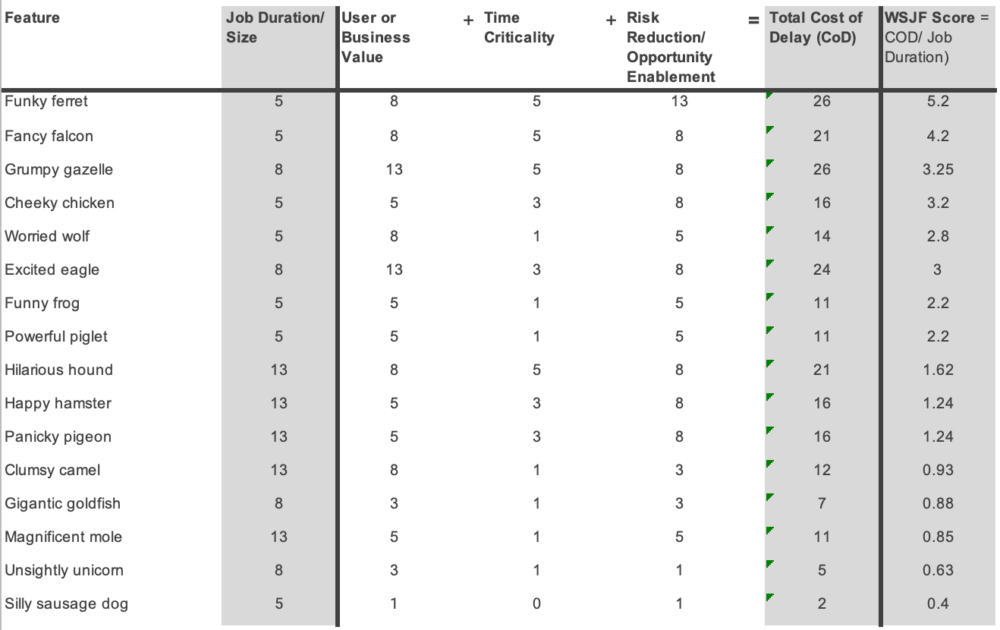
In summary, what you have to do is:
- Create your list of high-level features or epics
- For job duration/ size, rather than using exact story points or time estimates, score it with a relative measure – I tend to use a simplified Fibonacci sequence (1, 3, 5, 8, 13)
- Use the same sequence to assign:
- User/ business value – How much value does it add to your weighted user groups? What is the revenue impact on the business?
- Time criticality – How does user/ business value decay over time? Is there a fixed deadline? What is the current effect on customer satisfaction? Are any milestones impacted by this?
- Risk reduction/ opportunity enablement – Does this feature reduce risk? Will it unlock new business opportunities?
- The sum of these 3 factors is your Cost of Delay (CoD)
- Calculate your WSJF score by dividing the CoD by Job Duration/ Size
- Sort the column of the WSJF score highest to lowest which will give you your priority order
Prioritization Matrix
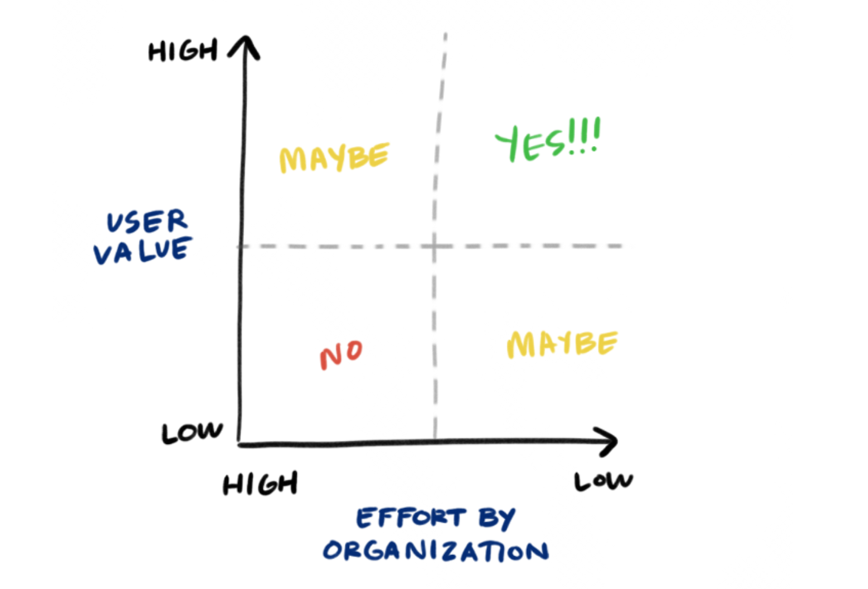
Now, for visualizing this output, in the past, I have used a prioritization matrix to map features against the two dimensions of user value and effort, as described and visualized by NN/g:
When I was looking into options for how I might add the third dimension of WSJF for an exact prioritization by best economic return to the matrix, I found a great article by Scott Hammer who described how he made it work with his team. With his and criticaltosuccess.com‘s instructions on how to create a four-quadrant matrix model in an Excel chart, I created this template that I have been using for our feature prioritization at Brainnwave.
Notes:
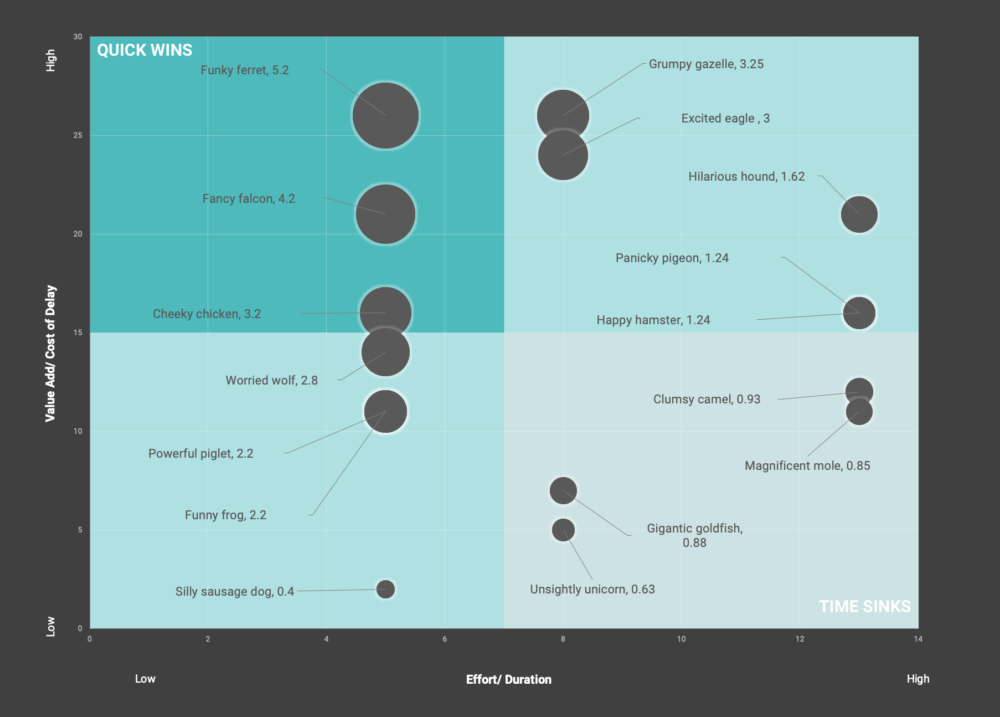
- I have not marked the quadrants with Do Now, Do Next, Do Later, Don’t Do because that would not take into consideration the 3rd dimension of WSJF. If you are interested in the WSJF sequence, the most important thing to look at when reading the matrix is the bubble size/ the WSJF score next to the feature label.
- The traditional magic quadrant would put Effort/ Duration from high to low rather than low to high to show the winners in the top-right corner. It can be done either way but this is my personal preference, and I am hoping the background image with ‘quick wins’ and ‘time sinks’ makes it clear who the winners/ losers are.
- The matrix works best for visualizing high-level features or epics rather than all your user stories/ the whole backlog.
Within my team, the framework has been well received because of the transparency on why features are prioritized the way they are, and from senior management, because it keeps them involved and their voices captured in conversations about new features whilst taking into consideration the best economic return for the business.
Download xlsx Template
You can download the template here for free. If you have any feedback or suggestions for improvement, don’t hesitate to get in touch.