Place making experience, understanding and insight.
Mosaic Great Places helps developers create beautiful, exciting, and sustainable places for people to live, work and thrive. A market leading approach that combines decades of experience in place making with the power of AI to generate insights like never before.
Mosaic Great Places evolves a proven methodology into a compelling digital solution and is already helping developers to understand their projects and tackle their most complex challenges.
Through digitization you have an always up to date assessment of your designs, continually refreshed to understand changing customer demands.
Digital Scorecards
The power of data
Understand the true nature of your development and generate new design scenarios to react to ever-changing customer demands.
Benchmarking
How do you stack up?
Analyse competitor developments and assess your designs relative performance.
Quite the combination
The Great Places process combines decades of experience in urban development with cutting edge AI to help developers understand how to transform their projects into truly Great Places.
Digital Scorecards allow you to understand the true nature of your development and generate new design scenarios to react to every changing customer demands.
Benchmarking capability allows you to analyse competitor developments and assess your designs relative performance.
An always up to date commercial model means you always know where customers are placing value.
Data generated using AI technology for some of the world’s best performing developments gives you a level of insights never previously available to developers.
Data Science In Practice
Looking at just one of the many indicators we use for Great Places will give you an idea of the data science work in practice.
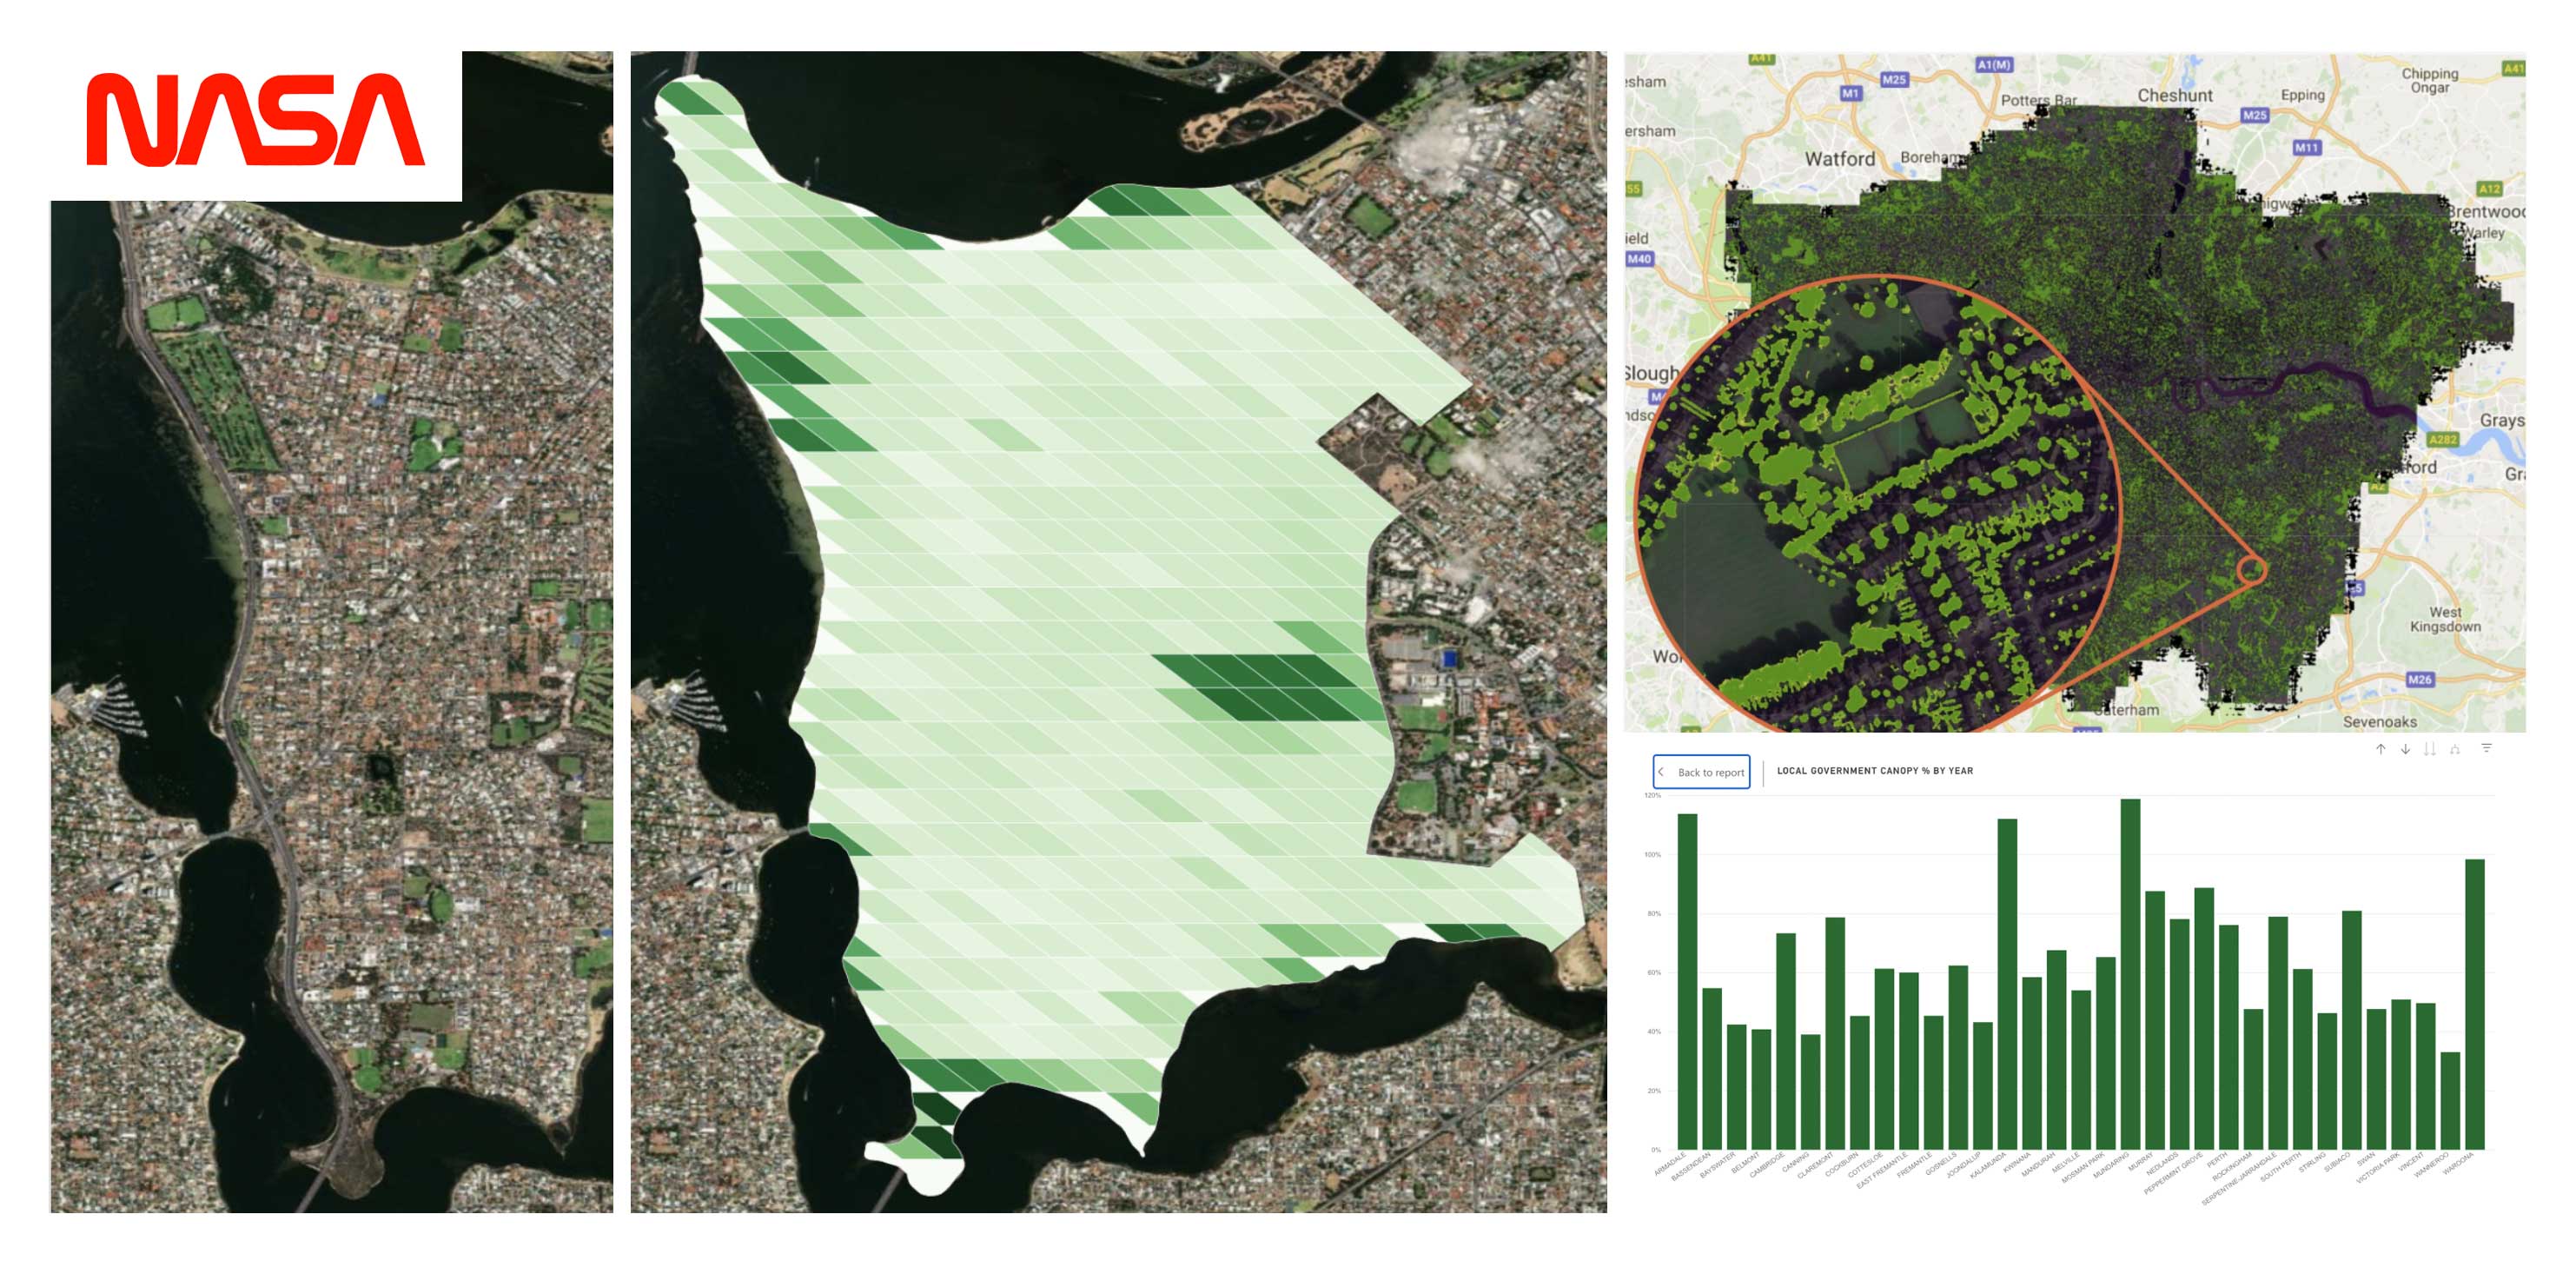
Let’s consider an estimate for Tree Canopy Cover (TCC, the percentage of an area covered by tree foliage) in various developments across Australia.
This data does not exist at the granularity level we require so the team have to be smart about creating it.
NASA’s TCC estimate, which covers the entire planet, is based on satellite data imagery and provides us with TCC at the 250m granularity level (i.e it divides the entire planet into cells of 250m x 250m).
After sourcing that data, we need to validate it; we found data sources to assess the need for recalibration.
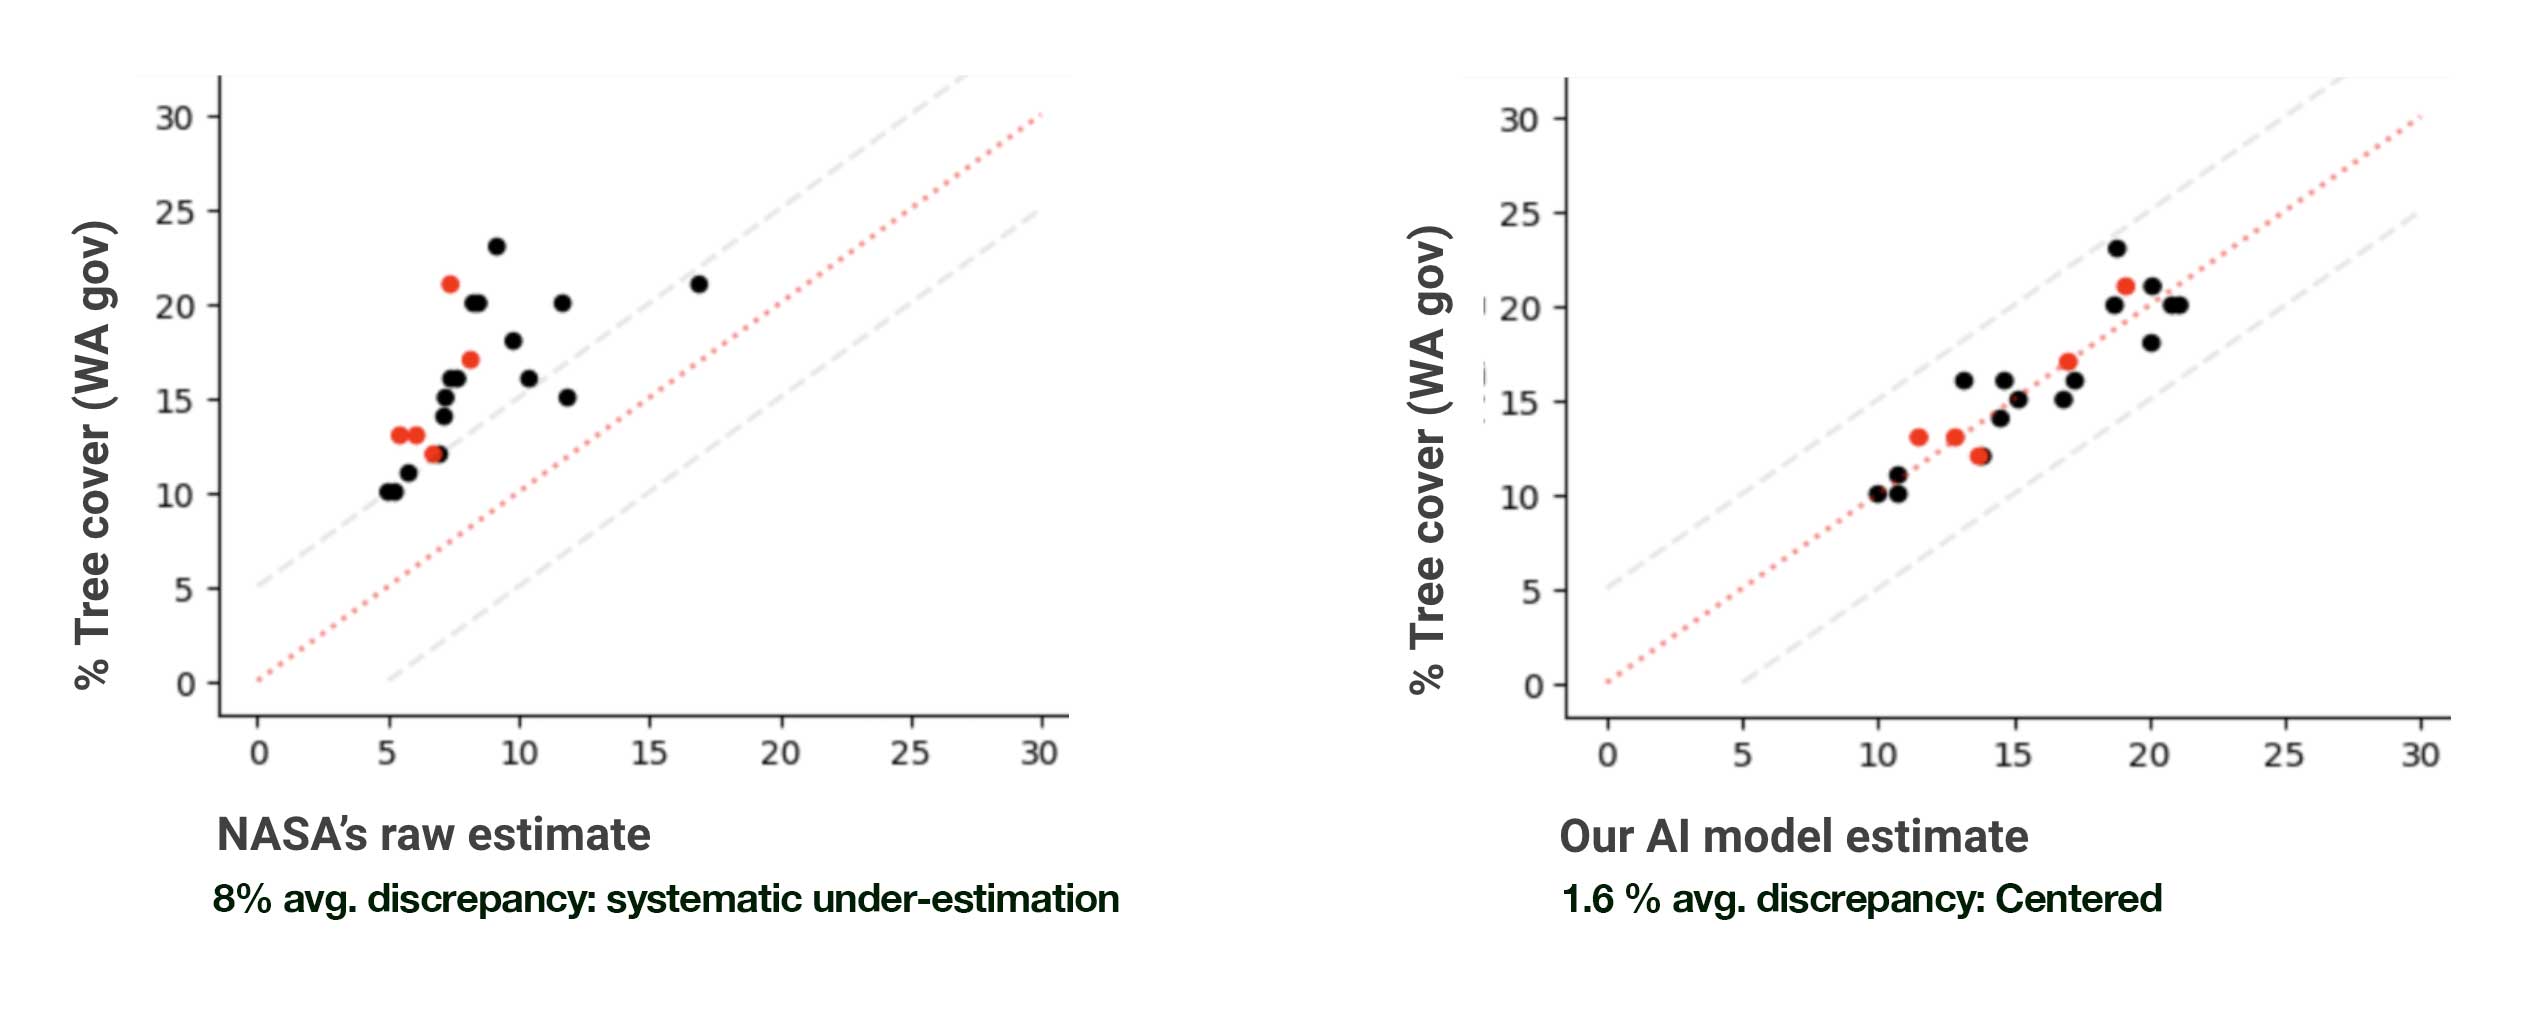
The Western Australian government publishes official numbers for the tree canopy cover in their main cities, and what we found was that NASA’s estimates for Wetern Australian cities are consistently undervalued.
We built a bespoke Machine Learning algorithm to use these other data sources to recalibrate NASA’s TCC estimates and reduced error by a factor of 5!
So now, we have a data source for Tree Canopy Cover, but NASA’s data requires recalibration which will differ depending on which part of the world we’re investigating. Assuming there are local data sources, then recalibration is possible and efficient.
Although there’s no one single source of truth for TCC, what matters is that we redefine TCC measures in line with numbers that are relevant for our clients.
Delivering for you
We don’t reinvent your designs; we help you optimize them to the latest buyer demands.
Create a robust, data-driven evidence base, benchmarked against local, national, and global standards for expedited planning approval.
AI driven mapping of your competitor’s developments to understand the relative strengths and weaknesses of your current designs.
Collaborative approach with a tailored solution built around the specific strategic goals you define for your development.
The process de-risks decision-making, by creating a robust evidence base and ensuring you can stay focused on delivering developments that enrich the quality of life for the people who will live, work, and visit them.
Mosaic Great Places enables our customers to stay at the cutting-edge of innovation and sustainability within urban design - creating truly great places people want to call home.
This website uses cookies so that we can provide you with the best user experience possible. Cookie information is stored in your browser and performs functions such as recognising you when you return to our website and helping our team to understand which sections of the website you find most interesting and useful.
Strictly Necessary Cookies
Strictly Necessary Cookie should be enabled at all times so that we can save your preferences for cookie settings.
If you disable this cookie, we will not be able to save your preferences. This means that every time you visit this website you will need to enable or disable cookies again.